Stop guessing. Start trading with context.
See the Report in detail.
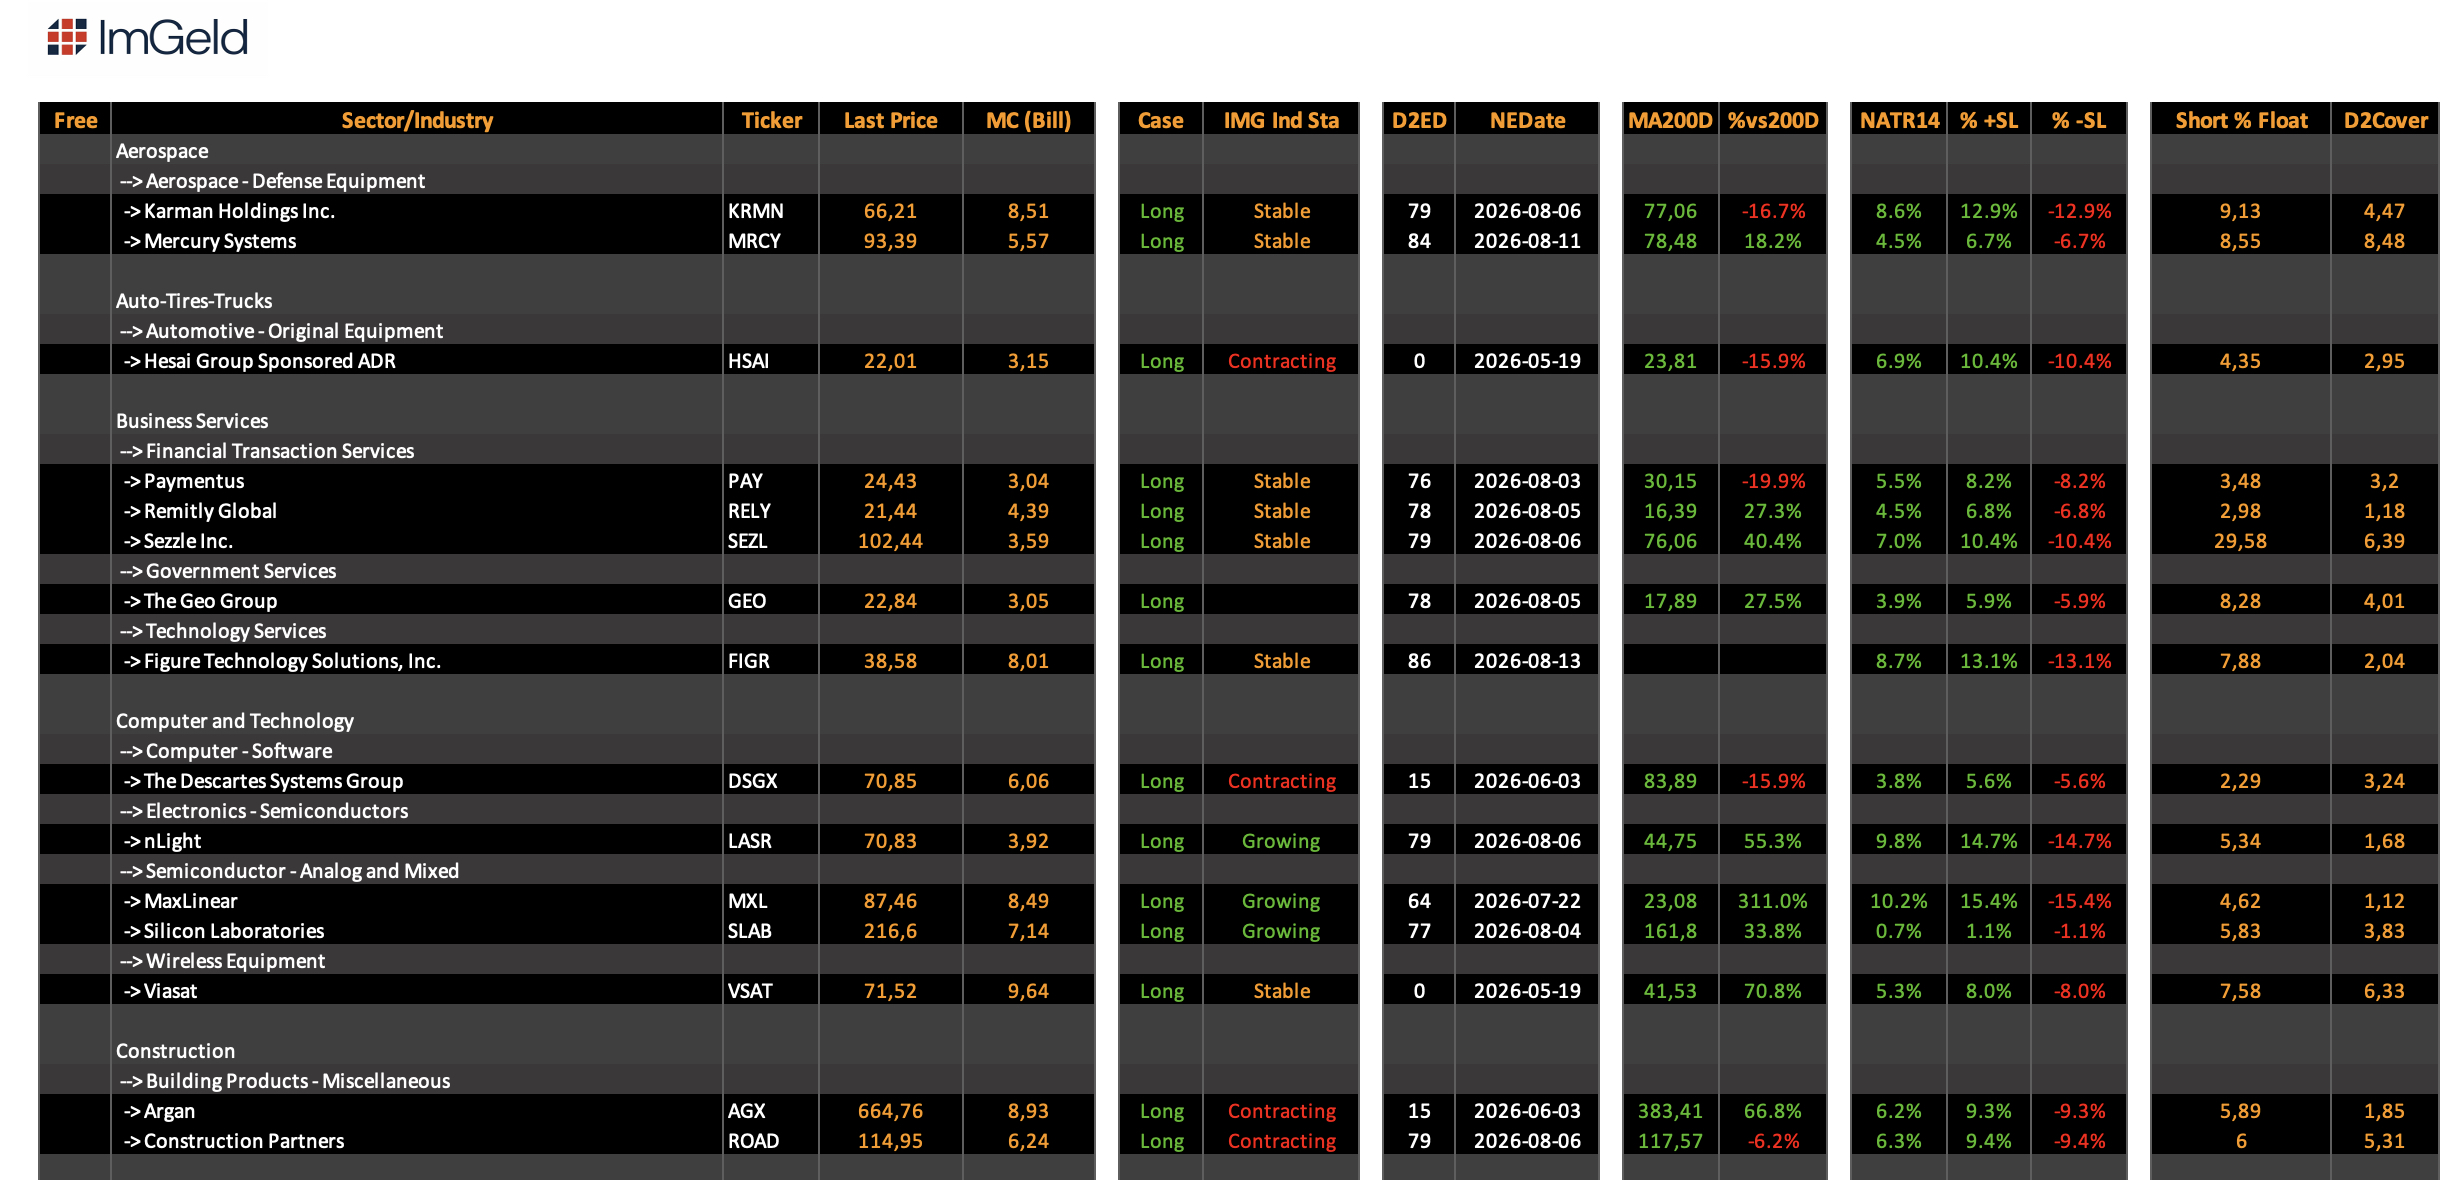
Every column, every signal, every chart. exactly how it lands in your inbox each morning.

Market → Industry → Stock.
Every morning, in that order.
A top-down framework used by institutional desks. Applied to 40 US industries daily, so you know where to focus before you open a single chart.
Market context first
Market breadth, participation, leadership rotation, and risk regime, logged before anything else, because no stock works in isolation from the broader market.
Rank 40 industries
40 US industries ranked daily by Industry Strength Score. The top of the ranking becomes the hunting zone for Longs. The bottom, for Shorts.
Filter the candidates
Inside the strongest and weakest industries, stocks are filtered by fundamental profile, earnings growth, valuation, volatility, and other criteria.
No Random Tickers.No Hype.
Each stock in the report comes with the information you need to evaluate, size, and act. Plus direct access to the chart.
Long or Short tag
Each candidate is clearly tagged. You know which side of the trade you are evaluating before you open a chart.
Industry classification & momentum
Know which industry the stock belongs to and whether that industry is expanding, stable, or contracting.
Volatility profile (NATR)
Volatility data for every candidate, so you size positions consistently across different names.
Upcoming earnings date
Never enter a position blind. Every candidate shows the next earnings date so you manage event risk.
Distance from 200-day MA
Know where each stock stands structurally before you act, above, below, or near the 200-day moving average.
One-click Finviz chart
Each ticker links directly to its chart on Finviz. No searching, no copy-pasting tickers.
Start with 7 days free.
No card charged until day 8. Cancel anytime before then and pay nothing.